I found the article on the web : http://www.airbum.com/pireps/PirepMauleM-7-235C.html
I am looking for inputs and experience with this subject. The author thinks that 1100fpm is a constant. Has anyone compiled any data that has been charted on temperature and altitude connected with takeoff distance or climb performance for a M7235C ?
Altitude Density Chart
-
Green Hornet

- 100+ Posts
- Posts: 606
- Joined: Sat Aug 26, 2006 8:53 pm
- Location: No Name City, No Where Land, USA
- Contact:
-
TomD
- 100+ Posts
- Posts: 1361
- Joined: Sat Aug 26, 2006 7:13 pm
- Location: Seattle area ( S43 )
- Contact:
Density altitude calculator
I bought a little performance calculator from Sporty's years ago.
http://www.sportys.com/acb/showdetl.cfm ... ct_id=1251
It has sliders which ask, atltitude, temp., runway condition(paved, grass, etc.), slope, wind, SL climb rate, etc. Line up w/ the takeoff roll ( have Cessnas and Pipers etc listed ) and read climb rate and take off and 50' clearance distance off the scale.
I fly out of a sea level airport so detemining the base numbers is pretty easy, but you can back calculate from where you fly.
It is not a Bible it is pretty darn close especially when you add the Old Pilot fudge factor vs. the Bold Pilot factor..
Tom
-
Green Hornet
- 100+ Posts
- Posts: 606
- Joined: Sat Aug 26, 2006 8:53 pm
- Location: No Name City, No Where Land, USA
- Contact:
-
donknee

- 100+ Posts
- Posts: 163
- Joined: Sat Aug 26, 2006 6:50 pm
- Location: olympia, wa
- Contact:
on the other hand...
1% grade= 10% effective runway length, 9kts headwind= 10% shorter takeoff, 2kts tailwind= 10% increase t/o or landing, 10% increased goundspeed= 20% longer landing. If you take good notes or have an observer taking notes with you and you know how your gross weight/take-off and landing distance, rate of climb, etc. these can be pretty useful. These are "general and approximate", but will give you a good idea of the relationship of these factors upon performance. 
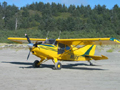
1976 M5-235-C
-
Green Hornet
- 100+ Posts
- Posts: 606
- Joined: Sat Aug 26, 2006 8:53 pm
- Location: No Name City, No Where Land, USA
- Contact:
-
Jet-A
- Posts: 32
- Joined: Mon Jan 08, 2007 7:06 pm
- Location: KSAC
- Contact:
T.L.A.R.
DON'T forget about T.L.A.R., one of the later chapters in the book titled, Experience.
For those of you who are not engineers and/or have never heard the offical acronym "T.L.A.R.", it stands for "That Looks About Right"...

If you are unsure about what looks "about right", go get the experience someplace safe and then apply it. Don't forget to take those all-important mental notes to insert into your book, Experience.
CHEERS!
BTW - Jeremy has this really thick book, Experience, but he has it titled differently as, Been There, Done That - Got the T-Shirt!
For those of you who are not engineers and/or have never heard the offical acronym "T.L.A.R.", it stands for "That Looks About Right"...
If you are unsure about what looks "about right", go get the experience someplace safe and then apply it. Don't forget to take those all-important mental notes to insert into your book, Experience.
CHEERS!
BTW - Jeremy has this really thick book, Experience, but he has it titled differently as, Been There, Done That - Got the T-Shirt!
-
maules.com
- 100+ Posts
- Posts: 3144
- Joined: Tue Aug 29, 2006 4:01 pm
- Contact:
-
Jet-A
- Posts: 32
- Joined: Mon Jan 08, 2007 7:06 pm
- Location: KSAC
- Contact:
-
Jet-A
- Posts: 32
- Joined: Mon Jan 08, 2007 7:06 pm
- Location: KSAC
- Contact:
DAlt Charts, Performance Charts, & Rules of Thumb...
As an instructor, when I do "mountain checkouts", I regularly take students up to South Lake Tahoe and then over to Truckee during the heat of the summer months. I have the student compute all of the data prior to leaving and we always start by going to South Lake Tahoe first.
It's one thing to coldly compute the data based on tables, charts, and rules of thumb calculations. It all seems "OK" on paper, but it's quite another to suck up a cushion when the airplane just won't go up as fast as you were used to and the fact that the trees are getting really friggin' close! In South Lake Tahoe, the summer winds usually come from the southwest and create a slight downdraft over the airport. You have to use the little ridge to the east to gain immediate lift and then turn back towards the lake to continue climbing.
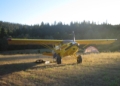
 <-- Typical expression 30 seconds after getting airborne...
My students usually "opt out" of the trip over to Truckee and would rather get back to Sac to clean out their shorts instead. Needless to say, the fllights usually make an impression on them and if nothing else, my students won't be the ones that say, "It can't happen to me..."
Don't get me wrong - it's great to have factual data at your fingertips, but going too far outside of your comfort zone makes you a good candidate for panic, which in turn shuts down the rest of your brain and can kill you. That's why I use TLAR as the basis of all of my flights.
Just my $0.02 - Take it for what its worth.
CHEERS!
It's one thing to coldly compute the data based on tables, charts, and rules of thumb calculations. It all seems "OK" on paper, but it's quite another to suck up a cushion when the airplane just won't go up as fast as you were used to and the fact that the trees are getting really friggin' close! In South Lake Tahoe, the summer winds usually come from the southwest and create a slight downdraft over the airport. You have to use the little ridge to the east to gain immediate lift and then turn back towards the lake to continue climbing.
My students usually "opt out" of the trip over to Truckee and would rather get back to Sac to clean out their shorts instead. Needless to say, the fllights usually make an impression on them and if nothing else, my students won't be the ones that say, "It can't happen to me..."
Don't get me wrong - it's great to have factual data at your fingertips, but going too far outside of your comfort zone makes you a good candidate for panic, which in turn shuts down the rest of your brain and can kill you. That's why I use TLAR as the basis of all of my flights.
Just my $0.02 - Take it for what its worth.
CHEERS!
Who is online
Users browsing this forum: No registered users and 52 guests